Transport, Postal & Warehousing Reporting
Fleet, delivery, route, warehouse and fuel reporting for transport, postal and logistics operators. Explore each report type below to see what it measures, why it matters, and how SolveBI builds it on Microsoft Power BI and Fabric for Australian transport, postal & warehousing businesses.
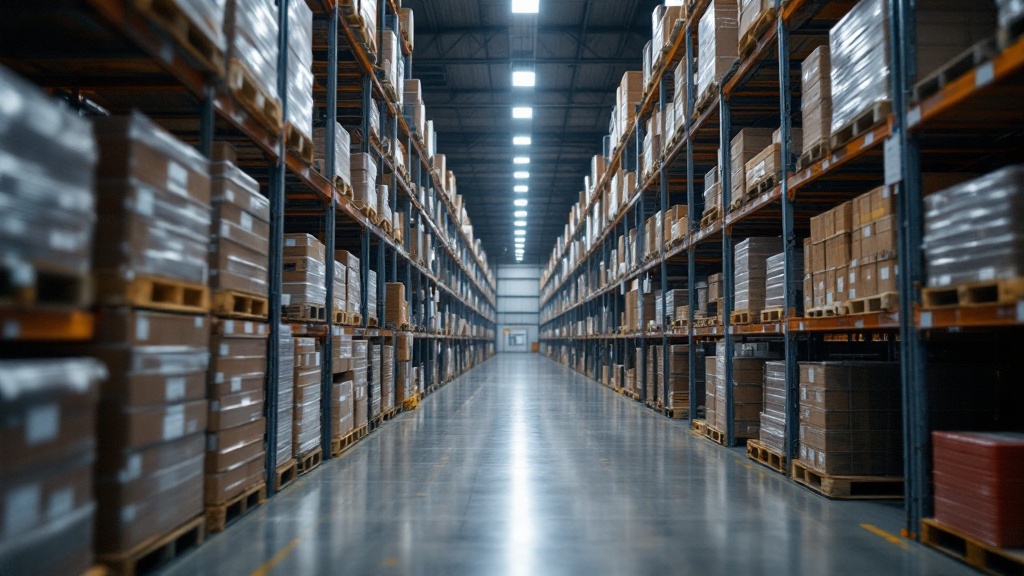
Warehouse Operations Reporting
Warehouse operations reporting is where labour, layout, equipment and demand collide. Done well, it turns a busy warehouse into a measured one. Here is what good warehouse operations reporting looks like, and how SolveBI builds it on Microsoft Power BI and Fabric.

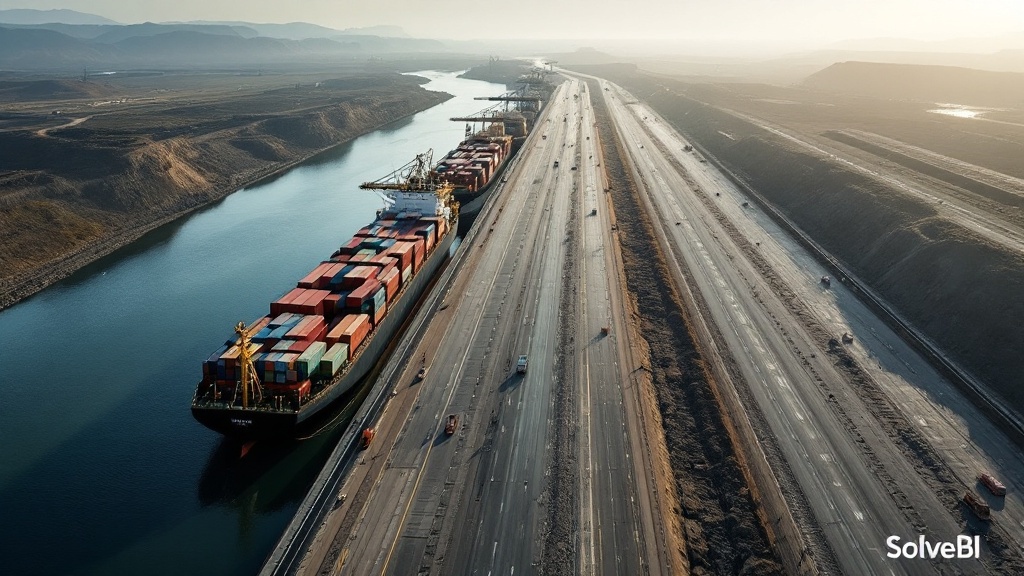
Delivery Performance Reporting for Logistics
Delivery performance reporting is the difference between an operator who explains delays and one who prevents them. Here is what modern delivery performance reporting looks like for Australian logistics and postal operators, and how SolveBI builds it on Microsoft Power BI and Fabric.

Fuel Consumption Reporting for Fleets
Fuel is one of the largest controllable costs in any transport fleet - and one of the least systematically measured. Here is what modern fuel consumption reporting looks like, and how SolveBI builds it on Microsoft Power BI and Fabric for Australian transport operators.
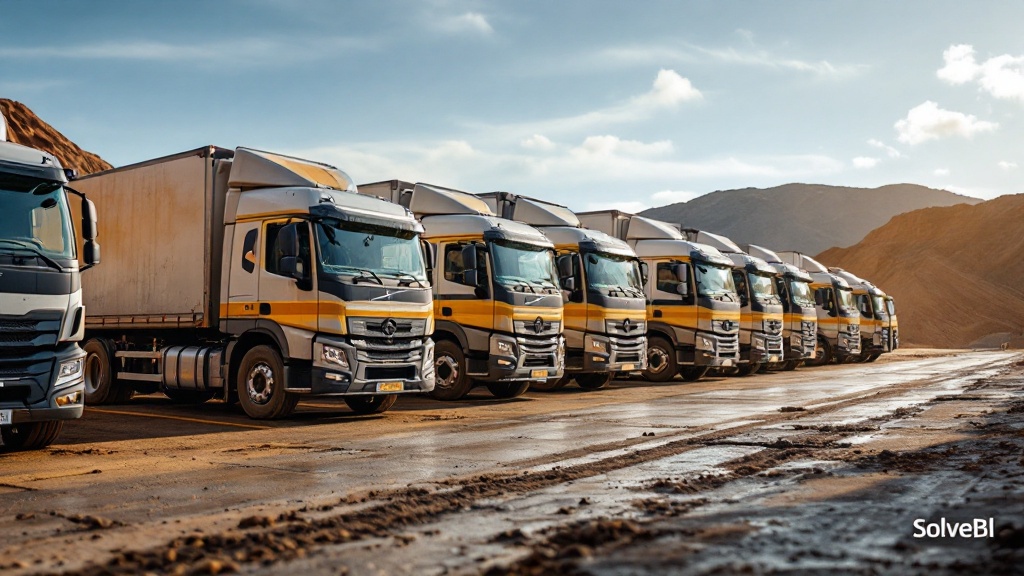
Fleet Utilisation Reporting for Operators
Most fleet operators have more capacity than they realise - and less than they need. The difference is utilisation reporting. Here is what good fleet utilisation reporting looks like, and how SolveBI builds it on Microsoft Power BI and Fabric for Australian operators.
Route Efficiency Reporting
Route efficiency reporting is where the difference between planned and actual route performance shows up - and where the next round of operational savings usually hides. Here is what good route efficiency reporting looks like, and how SolveBI builds it on Microsoft Power BI and Fabric.
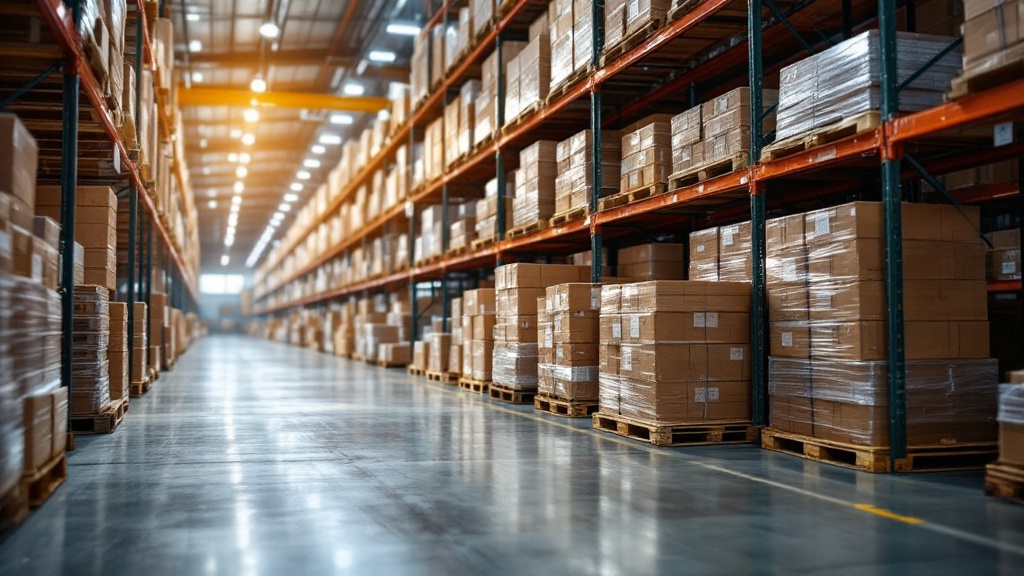
Inventory Turnover Reporting for Distribution
Inventory turnover reporting is what tells a distribution network whether stock is working hard enough to justify the working capital it consumes. Here is what good turnover reporting looks like across multi-warehouse networks, and how SolveBI builds it on Microsoft Power BI and Fabric.
Need a custom transport, postal & warehousing report?
We build production-grade Power BI and Microsoft Fabric reporting tailored to the way your transport, postal & warehousing business actually operates. Talk to a Perth-based consultant - no sales script, no obligation.